Split Results
What will you see after splits?
After creating a split for a particular machine learning task with given sets of data, the user is able to see the overview of the split. There can be multiple splits for the same dataset and different tasks. For example, a car dataset with 10000 images can have 8000 images for training, 1000 for testing, and the rest 1000 for validation. It can also have another split with varying numbers of training, testing, and validation data.
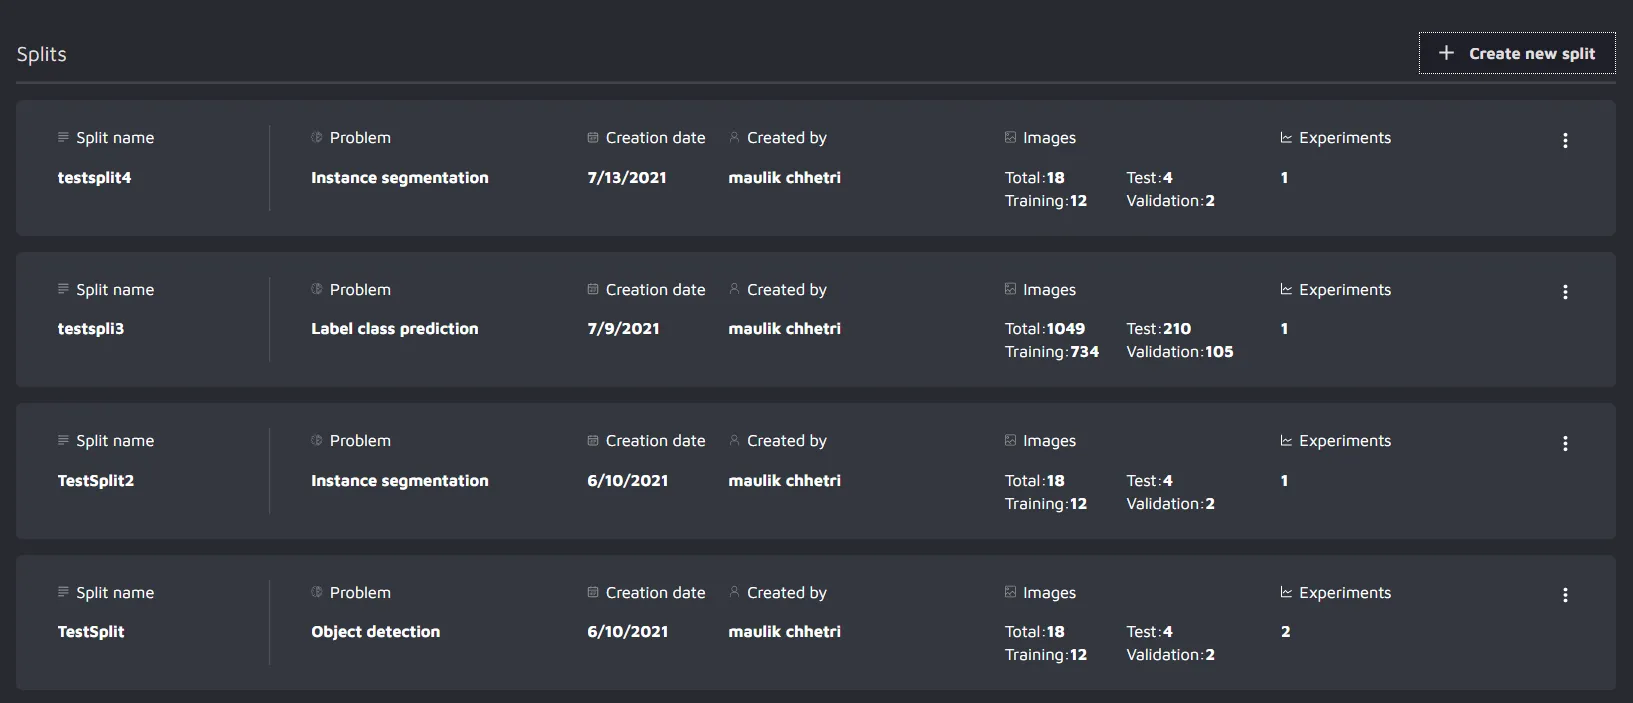
Split info
To view the information of the split, just click on the three dots present in the top right corner of each split and choose split info.
In the split information, the user can see the different images by filtering out different attributes.
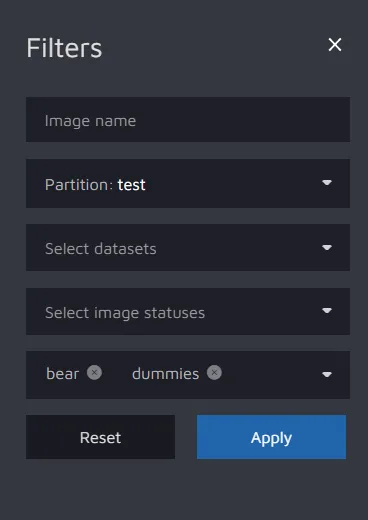
For example, here I have filtered the to see the test data with the labels bear and dummies.
Then, I can see the following result:

Split Summary
The user can also view the split summary by clicking on "Summary" in split info.

For the label class prediction split, the user is able to view the distribution of the different labels in the test, train, and validation set.
Entering in a split
Clicking any of the splits will give access to the creation of an experiment.

All the existing experiments can be viewed at the left sidebar. Here exp1 has been created.