Average Precision
If you have ever wondered how to evaluate an Object Detection algorithm, you might have heard of a well-known mean Average Precision (mAP) Machine Learning (ML) metric. As the name suggests, mAP is calculated by taking a mean value from Average Precision scores. So, to understand mAP, you must first understand the Average Precision concept. On this page, we will:
Сover the logic behind the Average Precision metric;
Find out how to interpret the metric’s value;
Calculate Average Precision on a simple example;
And see how to work with Average Precision using Python.
Let’s jump in.
What is the Average Precision score?
Like the Area under the Precision-Recall curve (AUC-PR) metric, Average Precision is a way to summarize the PR curve into a single value. To define the term, the Average Precision metric (or just AP) is the weighted mean of Precision scores achieved at each PR curve threshold, with the increase in Recall from the previous threshold used as the weight.
Average Precision formula
Sure, such a definition might be tough to process. Still, everything will become accessible as soon as you look at the formula.
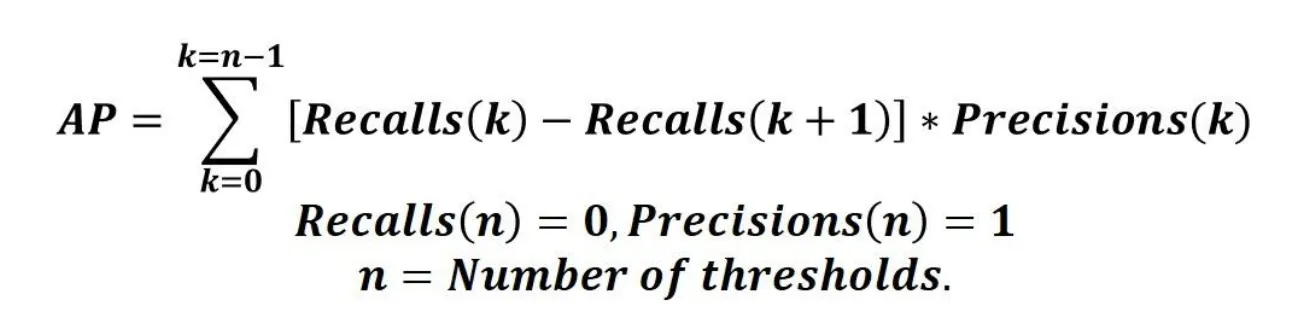
Source
So, the general Average Precision calculation algorithm is as follows:
Get the predictions from your model, define the thresholds, and build a Precision-Recall curve (in the multiclass case, you can compute Micro or Macro Precision/Recall, for example);
Use a loop that goes through all Precision/Recall pairs;
Calculate the difference between the current and next Recall values (weight);
Multiply the weight by the current Precision value;
Repeat steps 2-4 for the next pair;
Summarize the obtained scores;
Analyze the Average Precision value.
Additionally, in real life, if you face a multiclass case, you might want to calculate the Average Precision score for each class separately. Such an approach will give you a better view of the algorithm’s performance as you will build PR curves for each category and understand whether your model is good at detecting specific class objects.
Interpreting Average Precision
It is easy to understand the AP value itself. If you are getting more correct predictions, it leads to a better PR curve and, as a result, to higher Average Precision. The higher the metric value, the better. The best possible score is 1, and the worst is 0.
However, it is difficult to set any benchmarks in the Average Precision case because the thresholds might highly vary depending on the Machine Learning task, type of the case (binary/multiclass), etc. So, we suggest you dive deeper into your task and develop your benchmarking logic if you want to use Average Precision as an evaluation metric.
Average Precision calculation example
Let’s check out how to calculate Average Precision on a simple example. Imagine us having the following Precision/Recall pairs.
0.5 | 1 |
0.7 | 0.6 |
0.75 | 0.5 |
0.9 | 0.3 |
1 | 0 |
Let’s start with calculating the weights:
1 - 0.6 = 0.4;
0.6 - 0.5 = 0.1;
0.5 - 0.3 = 0.2;
0.3 - 0 = 0.3.
0.5 | 1 | - |
0.7 | 0.6 | 0.4 |
0.75 | 0.5 | 0.1 |
0.9 | 0.3 | 0.2 |
1 | 0 | 0.3 |
Now it is time to multiply the weights by the corresponding Precision values:
0.5 * 0.4 = 0.2;
0.7 * 0.1 = 0.07;
0.75 * 0.2 = 0.15;
0.9 * 0.3 = 0.27;
The final step is to summarize the obtained values:
Average Precision = 0.2 + 0.07 + 0.15 + 0.27 = 0.69
Average Precision in Python
Average Precision as a standalone Machine Learning metric is not that popular in the industry. In real life, it is mostly used as a basis for a bit more complicated mean Average Precision metric. On this page, we decided to present one code block featuring working with the Average Precision in Python through the Scikit-learn (Sklearn) library.
In Sklearn, Average Precision can be found under the average_precision_score function.